 Use our simple WEB-BASED THERMAL MODEL to predict heat-up and cool-down profiles for your unique application now. Use our simple WEB-BASED THERMAL MODEL to predict heat-up and cool-down profiles for your unique application now.
This application models the thermal performance of the HVR Advanced Power Components resistors under pulsed duty. Analysis is available for the "C-series," "U-series," and "Disc/Assemblies."
1. Select which series you wish to model.
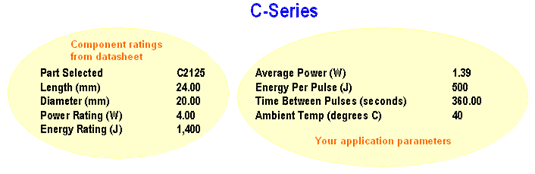
2. Select a particular part size from within the series. Once this information is entered, you will be given the ratings for the part selected. 3. Enter the energy per pulse, time between pulses, and the ambient temperature for your application. The Disk/Assemblies model serves the dual purpose of estimating performance for a single disk as well as multi-disk assemblies. You must enter a number for the qty. of discs to be used in series, (enter "1" if a single disk). Cooling fins may be used to increase the average power capability of an assembly. If cooling fins are to be used, enter the fin size (length of a side of a square fin 3mm (1/8") thick., enter "0" if no fins). 4. Click "FINISH". Two graphs are output to the report in a new window. The first graph, "First Two Cycles", shows the increment in temperature during each individual impulse, to illustrate short-term stress on the component. The second graph, "Peak and Valley Temperature", shows the temperature excursion over a longer period. A properly-sized component should reach equillibrium at an average temperature of <150C, with peak temperatures <230C for maximum lifetime. Please be aware that it is not possible for this model to take into account effects from other components located near the resistor or airflow around the resistor. It is designed to yield an estimate for temperature excursion of the resistor, to aid in part selection. This requires experimental verification in your actual application. Use our simple WEB-BASED THERMAL MODEL to predict heat-up and cool-down profiles for your unique application now.
Please tell us what you think of the model application - modelapplication@hvrapc.com
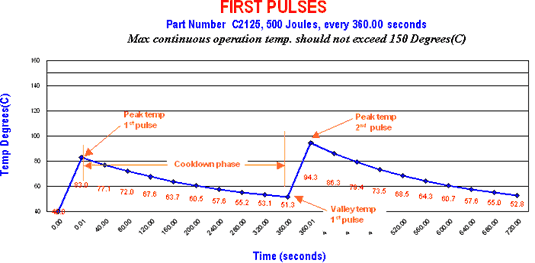
This graph shows short-term operation and quantifies the temp rise for a single pulse of given energy
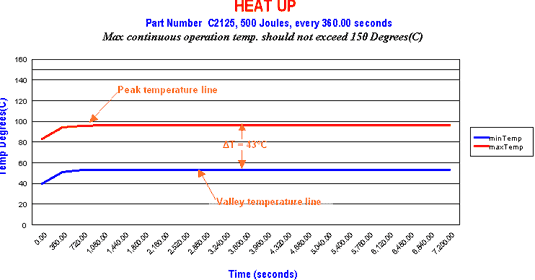
This graph demonstrates long-term operation by predicting peak and valley temperatures after many cycles
|